Leaflet-Maps Integration
Note
The Contao-Leaflet extension has not been continued for Contao 5 — the alternative is now Cowegis-Layer.
The Leaflet-Maps Integration enables the display of MetaModels in the netzmacht/contao-leaflet-maps extension.
Note
This documentation applies exclusively to Contao 4, even though the extension is also available for Contao 3.5.
Features
Render MetaModels items as markers on a map
Reference a layer in a MetaModels item and display it on the map
Link GeoJSON files in a MetaModels item and display them on the map
Leaflet map attribute: Render a map directly within a MetaModels item
Prerequisites
Contao 4
min. Contao 4.4
min. MetaModels 2.1
min. PHP 7.1
min. Symfony 3.4
Contao 3.5
(Bug fix support ending in May 2019)
MetaModels 2.0
min. PHP 5.4
Installation
netzmacht/contao-leaflet-metamodels can be installed via Composer/Contao Manager.
Integrating a MetaModel on a Map
This guide shows how a MetaModel containing geo coordinates can be displayed on a Leaflet map for Contao.
Coordinate Attributes
The geo coordinates can be defined in the MetaModel either as separate attributes or in a single attribute (latitude and longitude separated by a comma). A simple text attribute is suitable as the attribute type.
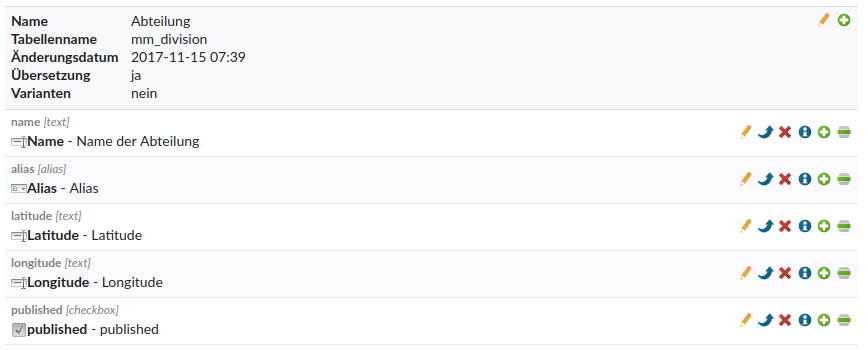
Latitude and Longitude attributes in the MetaModel
Creating a MetaModels Layer
As the next step, a new layer of type “MetaModels” is created under Map Layers. The following settings are required:
Type: Select MetaModel
MetaModel: The desired MetaModel
Bounds relation: Defines the relationship between the layer elements and the map bounds — select extend. The map bounds are extended by the defined markers.
Filter setting to apply: As usual with MetaModels, a filter setting is selected that influences the items to display.

Configuration of the MetaModels layer
Creating a MetaModels Layer Renderer
In the next step, it is defined how the MetaModels item should be displayed on the map. In this example, they are to be displayed as markers. The corresponding renderers can be created via the edit icon of the map layer.
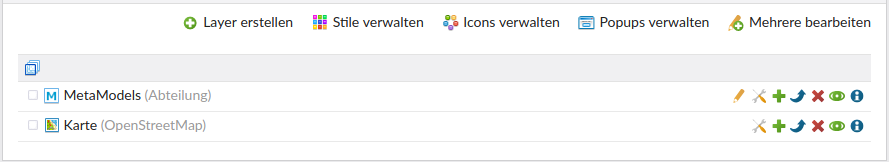
Overview of map layers
In the input mask, new renderers can be defined. The following settings are required:
Type: Select marker, as the MetaModels items are to be displayed as markers
Coordinates: Select separate if the latitude and longitude values are in separate attributes
Latitude attribute: Select the attribute for Latitude
Longitude attribute: Select the attribute for Longitude
Enable render setting: enable the render setting
Lazy loading: For larger lists, dynamic lazy loading of map data via an API is recommended. The data is then not rendered directly as JavaScript.
In addition to the basic configuration, the MetaModel can also be added as a popup to the marker. Two modes are supported here:
render: A render setting is selected and rendered
attribute: An attribute is rendered. A render setting must also be selected for this
It is also possible to influence the display as an icon. One of the predefined icons can be selected, or alternatively it can be determined via a MetaModels attribute.
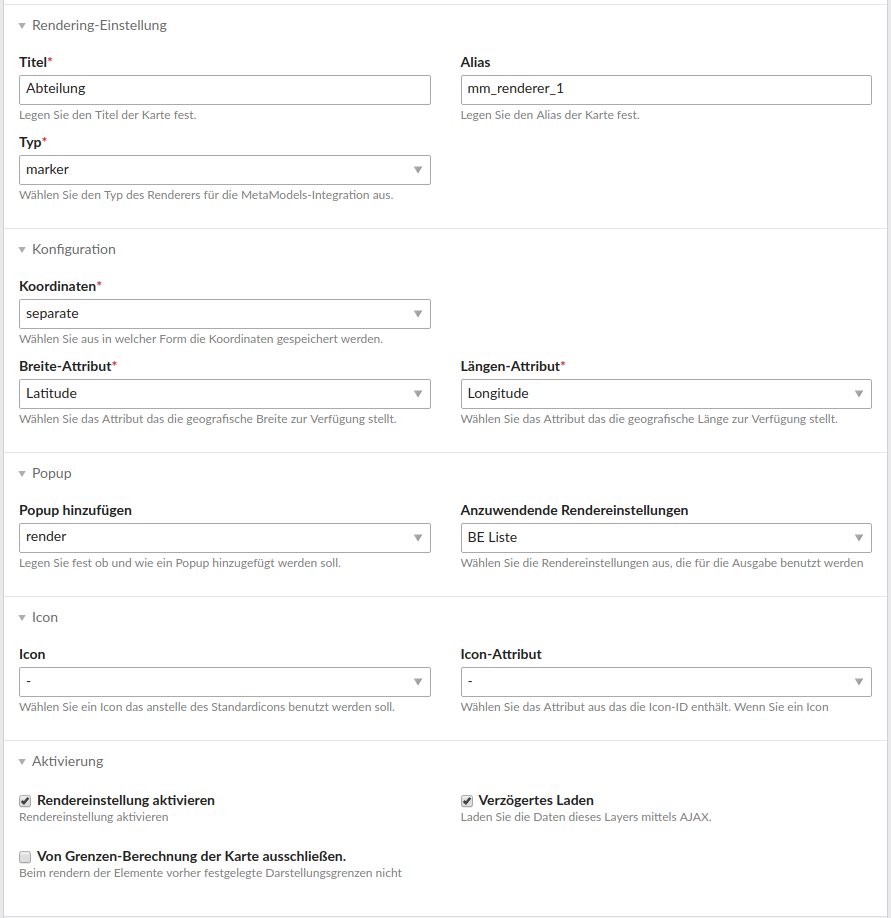
Renderer settings
Activating the Layer in a Map
As the last step, the layer must be assigned to a map for display. This can be done via the default layers of a map.
It is also recommended to activate the options on map initialization and after loading the deferred feature for the Set bounds function. This dynamically extends the map to the area where the markers exist.
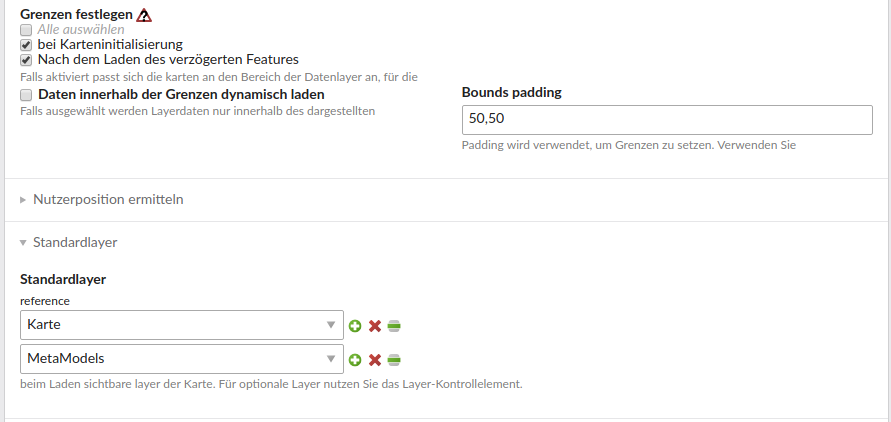
Map settings
If a filter is embedded on the page that serves the filter setting selected above, the map view is filtered accordingly.