Cowegis-Layer Integration for Markers
Cowegis-Layer enables the display of markers from MetaModels in the Contao extension Cowegis. With Cowegis, various maps, markers, polygons, etc. can be configured and rendered via Leaflet. The extension works with both monolingual and multilingual MetaModels.
Note
This extension is available from MM 2.4 with Contao 5.3 — to get access please send an email to mail@metamodel.me. Current open financing: 3,781.25 €
Installation
When installing Cowegis-Layer, the required base packages of Cowegis are automatically installed. If you also want to use Cowegis independently of MetaModels, it is recommended to install one of the following packages:
For multilingual output of data from MetaModels — e.g. for texts in popups — the Monolingual Pack is sufficient. The Multilingual Pack is for custom translations of maps themselves (uses the DC_Multilingual extension).
After installation and database migration, a new section “COWEGIS” appears in the backend navigation. Maps and markers can be created via the navigation items.
General Workflow
A map in Cowegis consists of multiple layers that combine different content in the overall map view. The most fundamental layer contains the map data itself. Since this map data is built from individual tiles, you will often read about tiles. On top of this “map” layer, various elements such as markers, polygons, etc. can be displayed via their own dedicated layers.
The workflow for creating a map with markers from MetaModels data is as follows:
Preparation:
Create a layer for map data
Create a map and embed the layer
Display the map
Displaying MetaModels Data
Create MetaModels data
Create a marker layer
Embed the marker layer in the map
Optional Settings
Configure icons
Configure popups
Create control elements
Create additional layers
Most input values have their equivalent in the Leaflet project, which provides the JavaScript library for map rendering. For unclear parameters, it is advisable to consult the examples and documentation there.
Preparation
Creating a Layer
In the Layers section, a new layer for the map display is created. The available types are “Tile Layer” or “Preconfigured Map”.
For the “Tile Layer” type, an appropriate URL template must be provided. These can be found at
the corresponding map providers, or the URLs can be extracted from the
Leaflet providers.
The typical URL for OSM is https://tile.openstreetmap.org/{z}/{x}/{y}.png. This layer type
provides configuration parameters for individual settings.
A simpler option is the “Preconfigured Map” type. Here, common map providers such as OSM, MapBox, etc. can be selected from a dropdown — the provider-specific parameters are automatically included.
Creating a Map and Embedding the Layer
In the next step, under “Maps”, a new map is created via “Create map”. Only the title is required here.
You can enter coordinates for an initial center position and zoom level. The coordinates for
centering can be determined via an address. To do this, open the map popup via the map icon
 , enter an address in the search field at the top right, and confirm with Enter. Clicking
“Apply” transfers the coordinates. The remaining parameters can be set or adjusted at a later time.
, enter an address in the search field at the top right, and confirm with Enter. Clicking
“Apply” transfers the coordinates. The remaining parameters can be set or adjusted at a later time.
If no initial centering is specified, you should ensure that the map positions itself correctly via other settings. For example, this can be done by enabling the “Set bounds” option on the activated layers (markers) of a map (see below).
After saving and closing, a new list entry appears for the new map.

The layers view icon  leads to the list of created layers.
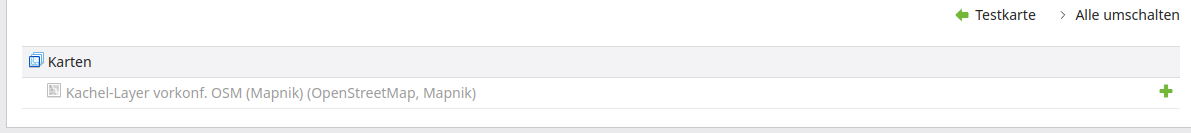
The green plus icon  adds or activates the created map layer. The green plus icon
switches to a red X icon
adds or activates the created map layer. The green plus icon
switches to a red X icon  , and the pencil
  and map icons appear.
The pencil opens the usual editing mask, and via the map icon you can define whether the map layer
should be displayed by default or not.
and map icons appear.
The pencil opens the usual editing mask, and via the map icon you can define whether the map layer
should be displayed by default or not.
If the map bounds should respond to a layer such as a marker layer, the “Set bounds” option must be activated (see above).
Even if a map layer is not defined as the default layer — the icon is disabled  — the
map data is still rendered in the frontend. However, the display is suppressed and can be toggled
via a layer control element (see below). This gives site visitors the option to actively switch
between different layers such as map types — e.g. with/without public transport or with/without
markers or polygons.
— the
map data is still rendered in the frontend. However, the display is suppressed and can be toggled
via a layer control element (see below). This gives site visitors the option to actively switch
between different layers such as map types — e.g. with/without public transport or with/without
markers or polygons.
Note that the map icon is not the usual “eye icon” for deactivating a record. To deactivate a
layer, you must open the editing mask via the pencil and uncheck the “Active” checkbox, or click
the red X icon in the list view.

Displaying the Map
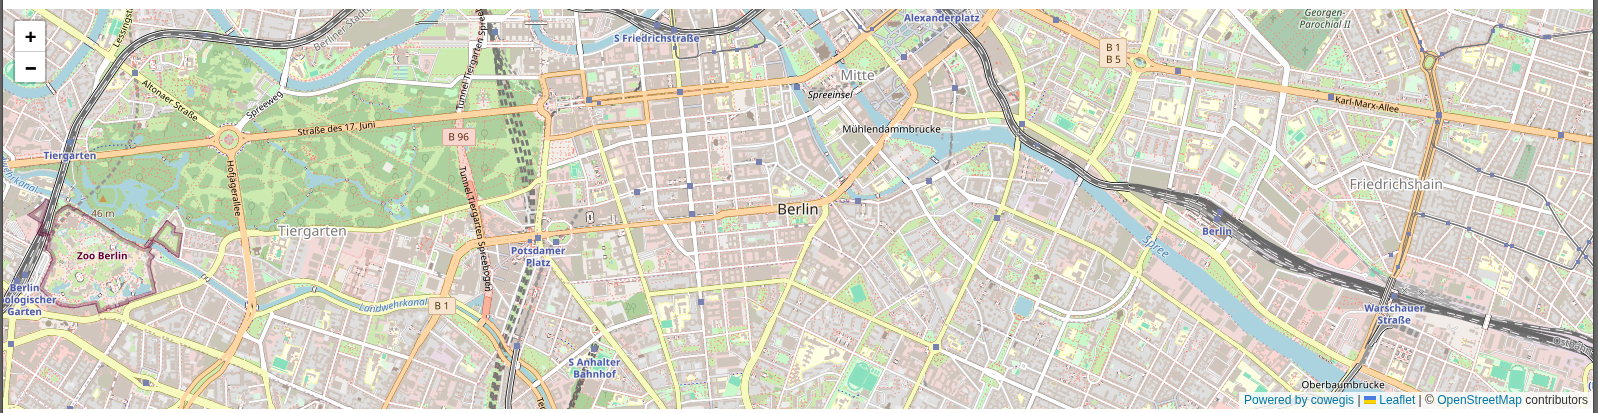
In the next step, the created map can be added as a content element or frontend module. To do this, open the corresponding editing mask and select “Cowegis Map” as the type. After selecting the Cowegis map, entering a map width and height, and saving, the map is visible in the corresponding frontend output.
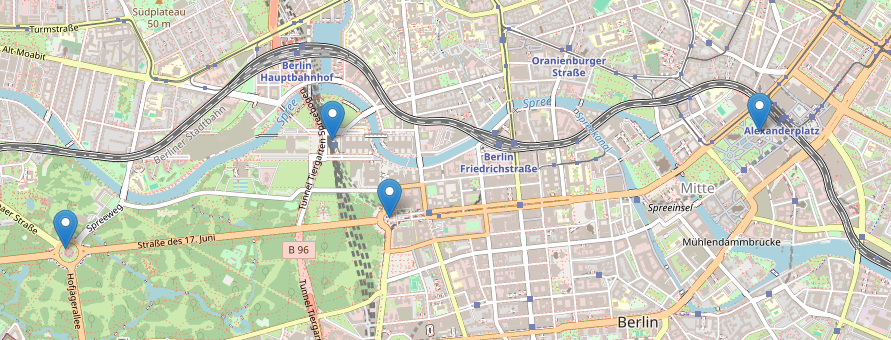
For the parameters “Center” with 52.510885,13.3989367 and “Zoom level” 14, the map
output looks approximately as follows:
Displaying MetaModels Data
Creating MetaModels Data
To display records as markers on a map, various data must be maintained in MetaModels. The following information may or should have corresponding attributes in MM (including the supported attribute types):
Coordinates (Latitude and Longitude required, Altitude optional) — Decimal for individual values or Text for comma-separated input
Title attribute (optional) — Text, Combined values, Translated text, Translated combined values
Alt attribute (optional) — Text, Combined values, Translated text, Translated combined values
Popup (optional) — Text, Long text, Combined values, Translated text, Translated long text, Translated combined values
The coordinates of the marker can be stored either as comma-separated values in a single field or
as individual values. For the first case, a Text attribute should be created that stores the tuple
(52.510885,13.3989367) or triple (52.510885,13.3989367,36). If coordinates are stored
individually, two or three Decimal attributes are required. Individual coordinate values must be
used if records are to be filtered using a
perimeter search from MetaModels.
The marker icon can optionally receive a text for the title or alt attribute. A corresponding Text attribute is required for this. The text must not contain any HTML formatting that would disrupt the HTML output.
For the marker, it is possible to display an info box as a popup when clicked. The content can come from an attribute such as “Text” or “Long text” and may also include HTML formatting such as links. How the attribute is rendered is determined by the selected render setting — the attribute should be present as an element in the render setting.
Alternatively, a dedicated render setting can be created for the popup. With a separate render setting, it is possible to combine the output of multiple attributes and render them with a custom template. Simple output of detail links (jumpTo) is also possible.
For all three text outputs (popup, title attribute, and alt attribute), both monolingual and translated MetaModels attributes can be used — multilingual output is supported.
Once all attributes have been created and populated with data, the next step is to embed them and allow the automatic creation of markers in Cowegis.
Creating a Marker Layer
After all preparations in MM are complete, a corresponding layer for displaying the markers can be created.
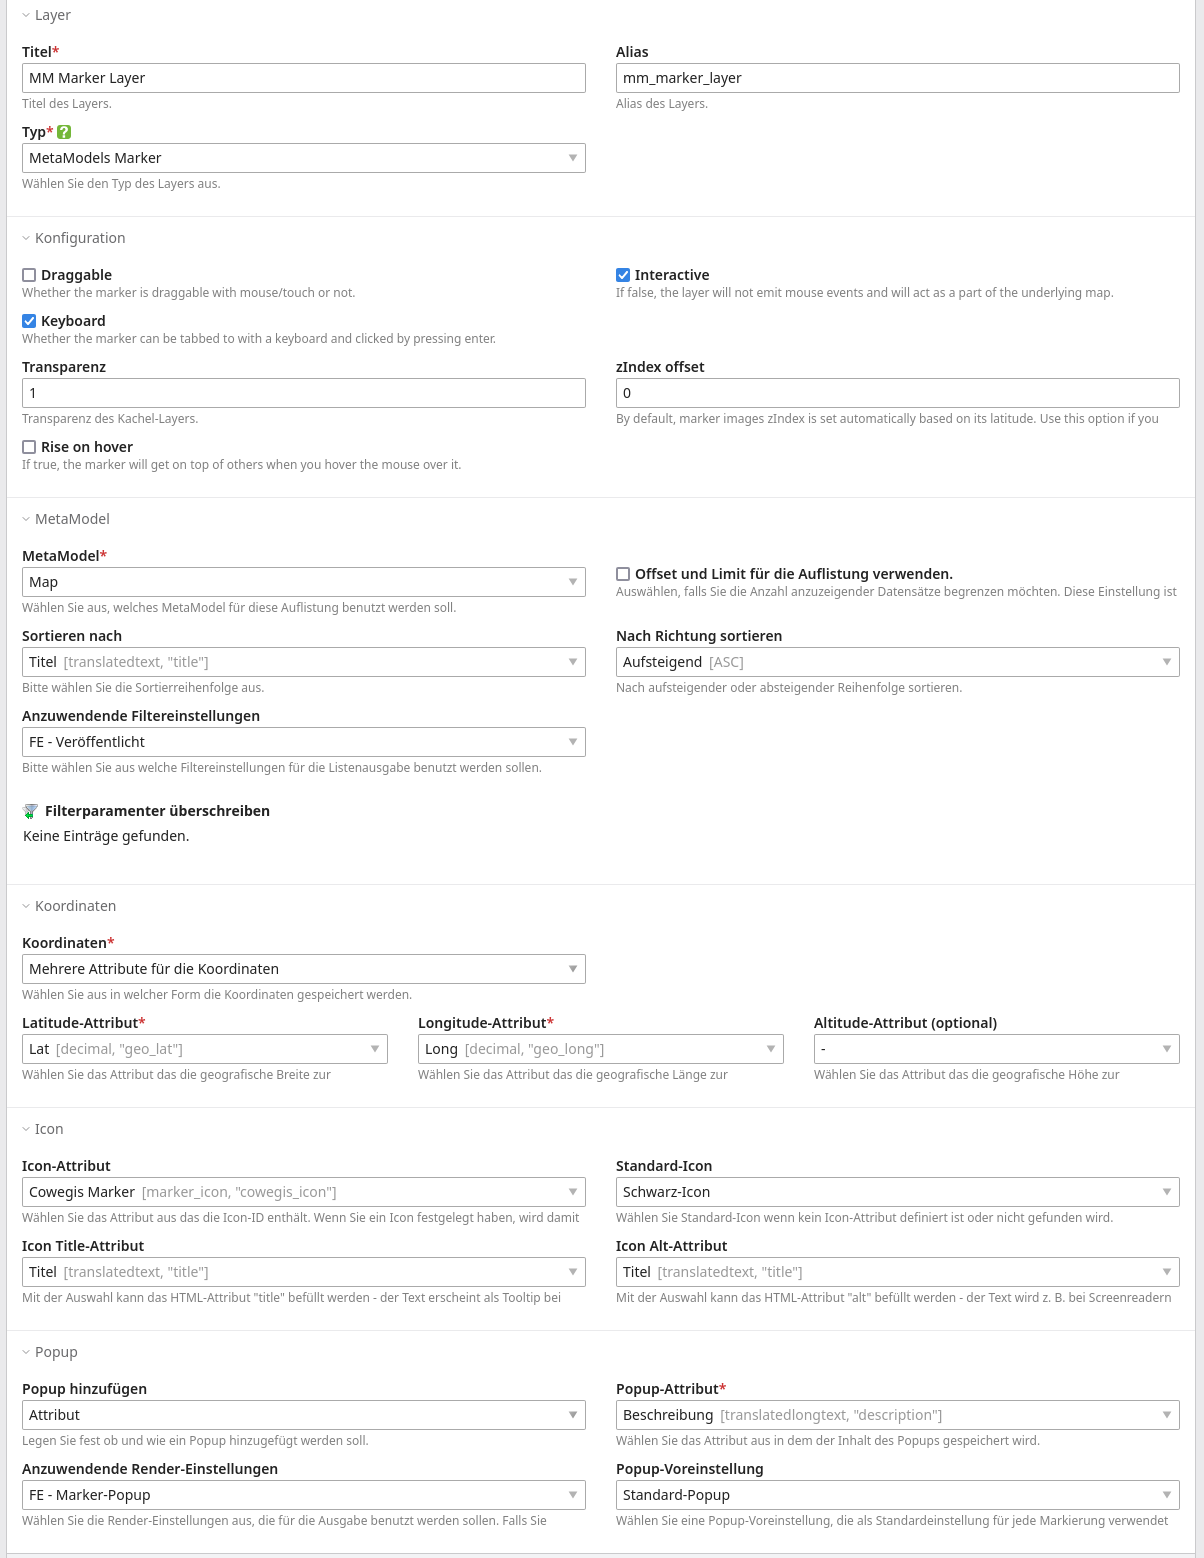
To do this, in Cowegis under Layer, use “Create layer” to create a new layer of the type “MetaModels Marker”. Selecting this type displays the appropriate input widgets in the form. In the “MetaModel” section, select the desired model. In the Coordinates section, you can choose between one or multiple attributes for the coordinates. Depending on the selection, one or three selects are available.
The settings in the Icon section are optional and are covered in more detail below. The selection of a MetaModels attribute for the title or alt attribute of the icon can be made here.
In the optional Popup section, “Add popup” allows you to specify whether a popup should appear and, if so, whether the content should come from a MetaModels attribute or from a separate render setting.
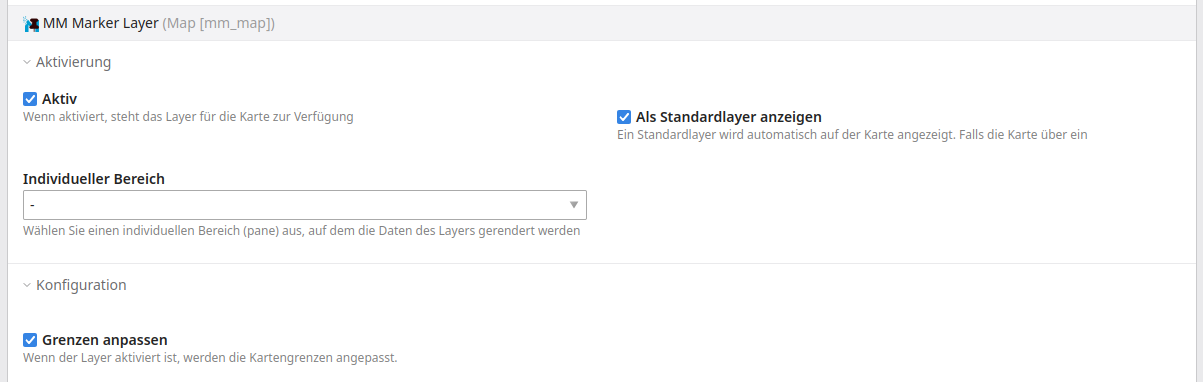
The following is an example of the configuration settings:
Embedding the Marker Layer in the Map
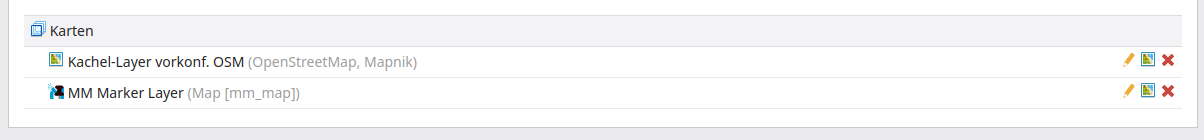
Once all inputs have been made and saved, switch back to the created map and open the layer view
.
There, the created marker layer is visible with the icon  and is
embedded with . The layer should also be set as a visible default layer — activate it
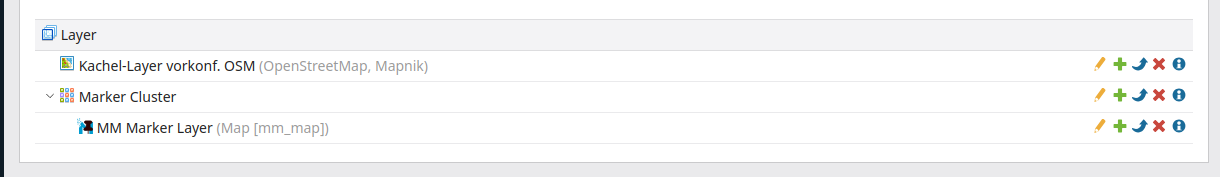
via editing or the map icon if necessary. The list of layers might look something like this:
and is
embedded with . The layer should also be set as a visible default layer — activate it
via editing or the map icon if necessary. The list of layers might look something like this:
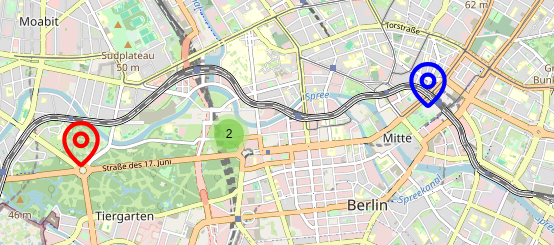
The following is an example of how markers might appear on a map:
If the map centering and zoom should respond to the markers, the “Fit bounds” option must be enabled — otherwise the default values for map centering and zoom are used.
Optional Settings
The output can be customized to your own wishes and requirements in various places. For example, in the layer settings for MetaModels markers, the transparency can be set in the Configuration section, or whether icons are keyboard-accessible via Tab.
Configuring Icons
The display of marker icons can be customized in many ways. The default icon from Leaflet at 25x41px is:
![]()
Custom icons can be created under Templates using “Create icon”. The following types are currently available:
File
DIV
SVG
Font-Awesome
File
With the “File” type, a file can be selected from
the file manager. If you don’t have your own file available, you can get an icon from icon fonts
like Lucide. The File type supports both PNG and SVG.
The icon size is determined by the original file or can be adjusted with
iconSize by specifying “width,height” in pixels;
e.g. 42,42.

DIV
With the “DIV” type, arbitrary HTML content can
be inserted into the “HTML” field — this can also be SVG source code. The following is an example
as a div container and CSS (iconSize 80,40):
 1<style>
 2/* http://projects.verou.me/bubbly/ */
 3.marker-bubble {
 4    position: relative;
 5    background: #00aabb;
 6    border-radius: .4em;
 7    text-align: center;
 8    padding: .6rem;
 9    color: #FFFFFF;
10}
11
12.marker-bubble:after {
13    content: '';
14    position: absolute;
15    bottom: 0;
16    left: 50%;
17    width: 0;
18    height: 0;
19    border: 1.719em solid transparent;
20    border-top-color: #00aabb;
21    border-bottom: 0;
22    border-left: 0;
23    margin-left: -0.859em;
24    margin-bottom: -1.7em;
25}
26</style>
27<div class="marker-bubble">
28    Hello!
29</div>
SVG
With the “SVG” type, a standard marker is rendered that can be customized not only in size
(iconSize) but also in color; the content of the “Content” field is displayed in the icon,
e.g. #42.

Font-Awesome
With the “Font-Awesome” type, a standard
marker including a Font-Awesome icon is rendered. The marker can be customized in size (iconSize)
as well as color. Font-Awesome icons are already bundled with the Cowegis extension — selection
is done by entering the icon name or CSS class.
The marker currently provides icons from Font-Awesome Free Version 6, e.g. “fa-envelope”.

Note that the icon name for “Icon CSS class” must be entered without the prefix, e.g. without
“fa-” — so just envelope. You must also select the appropriate set from “Regular, Solid,
Brands” for the desired icon.
The size of the marker is adjusted using “Icon size” and refers to the complete div container that
wraps the SVG for the “drop” shape as well as the Font-Awesome SVG. The div container has a
default size of 26,40 pixels — for a 50% enlargement, enter 39,60.
Selecting an Icon Template in MetaModels
A new “Cowegis Marker” attribute is available in MetaModels, which allows storing an icon template
from Cowegis in MM. The attribute is created as usual and enabled in the input mask. When a record
is edited, an icon template can be selected via a dropdown; the ID of the template is stored. In
the list output of the render setting, the name of the template is displayed by default — if you
change the attribute template to mm_attr_marker_icon_image, a preview of the icon is also
displayed in addition to the name (currently only for the “File” type).
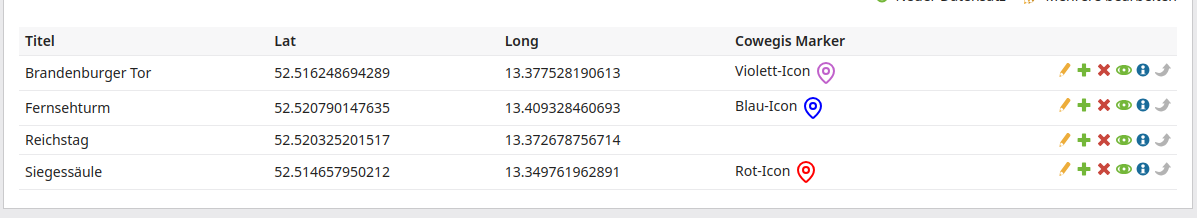
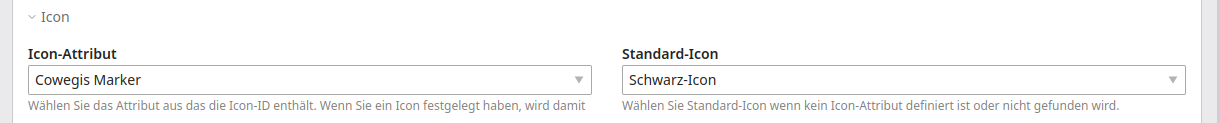
You can then customize the display of individual icons in the settings of the layer of type “MetaModels Marker”. In the Icon section, there is an “Icon attribute” selection where the “Cowegis Marker” attribute can be chosen. A custom default icon can be defined as a fallback — an existing icon template can be selected in the dropdown. If this setting also does not apply, the standard Leaflet icon is used.
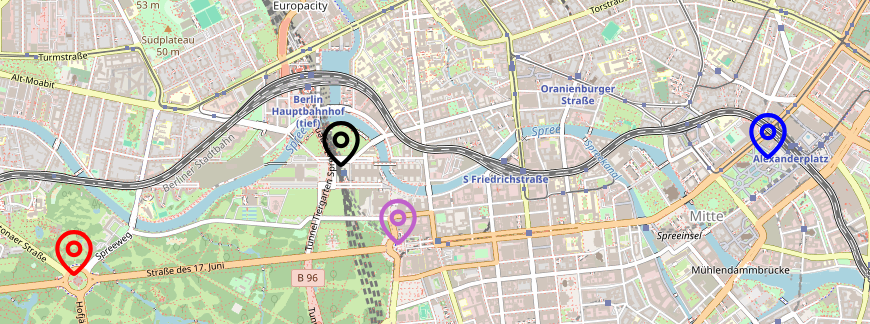
On the map this then looks as follows:
Configuring Popups
The display of popups can also be configured under Templates. Switch to the “Manage popups” view and run “Create popup” — then configure the desired settings.
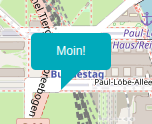
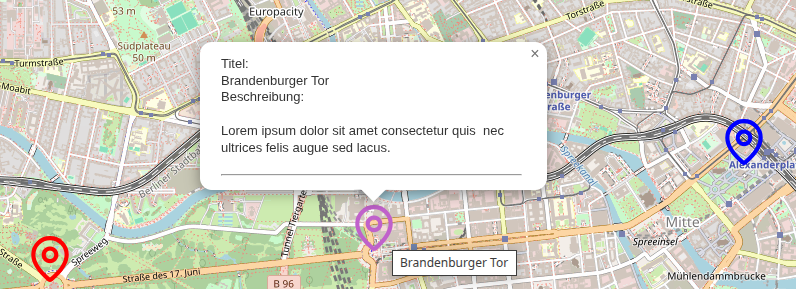
Afterwards, individual popup display can be configured in the settings of the layer of type “MetaModels Marker”. In the Popup section, activate the desired template under “Popup preset”. The following shows a map with an open popup and tooltip.
Creating Control Elements
In the map list, each map row has the icon  for creating control elements. Via
“Create control element”, various control elements can be created, such as:
for creating control elements. Via
“Create control element”, various control elements can be created, such as:
Attribution: The attribution control allows displaying author credits in a small text box on the map.
Fullscreen control: This setting adds a button that toggles fullscreen mode.
Layer control: The layer control gives frontend visitors the ability to switch between different layers and toggle overlays on or off.
Loading indicator: Leaflet.loading is a simple loading indicator as a control element.
Scale control: Simple scale control that shows the current scale at the center of the map.
Zoom control: This component enables control of the zoom behavior.
Creating Additional Layers
Finally, additional layers can be created that display, for example, fixed markers whose data does not come from MetaModels, or additional map types. If the layer control element is set up, frontend visitors can toggle these layers on or off.
One layer type is the “Marker Cluster”, which groups multiple nearby markers at low zoom levels into a circle icon showing the count. After creating the marker cluster, one or more marker layers are added as sub-levels of the marker cluster — existing marker layers are moved there.
The new Marker Cluster layer must also be activated in the map under Layers.

Depending on the zoom level, closely positioned markers are grouped together. The color of the cluster icon depends on the number of contained elements and can be customized via CSS. Clicking on a cluster adjusts the zoom so that the contents become visible.
Passing MM Filters to the Map
A map is often embedded alongside a filtered MM list — in this case, you naturally want the filtering to also affect the displayed markers.
Cowegis retrieves its data for generating the map and all other elements not directly via the content element, but the map element fetches the data via its own path. This request does not, however, receive the filter parameters from the URL.
Therefore, the filter parameters must currently be passed along with this request. Depending on
the financing of the extension, a more universal approach may be implemented in the future — until
then, parameters must be passed manually via map-uri.
For the transfer, the template of the Cowegis content element can be customized as follows:
 1<!-- templates/ce_cowegis_map.html5 -->
 2<?php $this->extend('ce_cowegis_map'); ?>
 3
 4<?php $this->block('content') ?>
 5<?php
 6$params  = [];
 7$keyList = ['address', 'address_range'];
 8foreach ($keyList as $key) {
 9  $params[$key] = \Contao\Input::get($key);
10}
11$paramString = http_build_query($params);
12?>
13<cowegis-map id="<?= $this->mapId ?>" style="<?= $this->mapStyle ?>"
14             map-uri="<?= $this->mapUri . '&' . $paramString ?>">
15</cowegis-map>
16
17<?php $this->endblock() ?>
If the map should adapt to the changed number of markers, the “Fit bounds” option must be enabled on the MM map (see above).
Custom JavaScript Customization
The map can be manipulated via JavaScript, e.g. to display additional markers or polygons. Note
that certain calls may be “overridden” by Cowegis JavaScript. For example, if the “Set bounds”
option is activated in the map settings, the fitBounds() method has no effect.
In that case, the option must be deactivated in the settings and handled via your own script. The following snippet can be used to start your customizations.
 1<script>
 2    const element = document.getElementById("<?= $this->mapId ?>");
 3
 4    const initializeMarker = function () {
 5        const map     = element.map;
 6        const leaflet = element.leaflet;
 7
 8        // Own code...
 9    }
10
11    if (element.map) {
12        initializeMarker();
13    } else {
14        element.addEventListener('cowegis:ready', initializeMarker);
15    }
16</script>
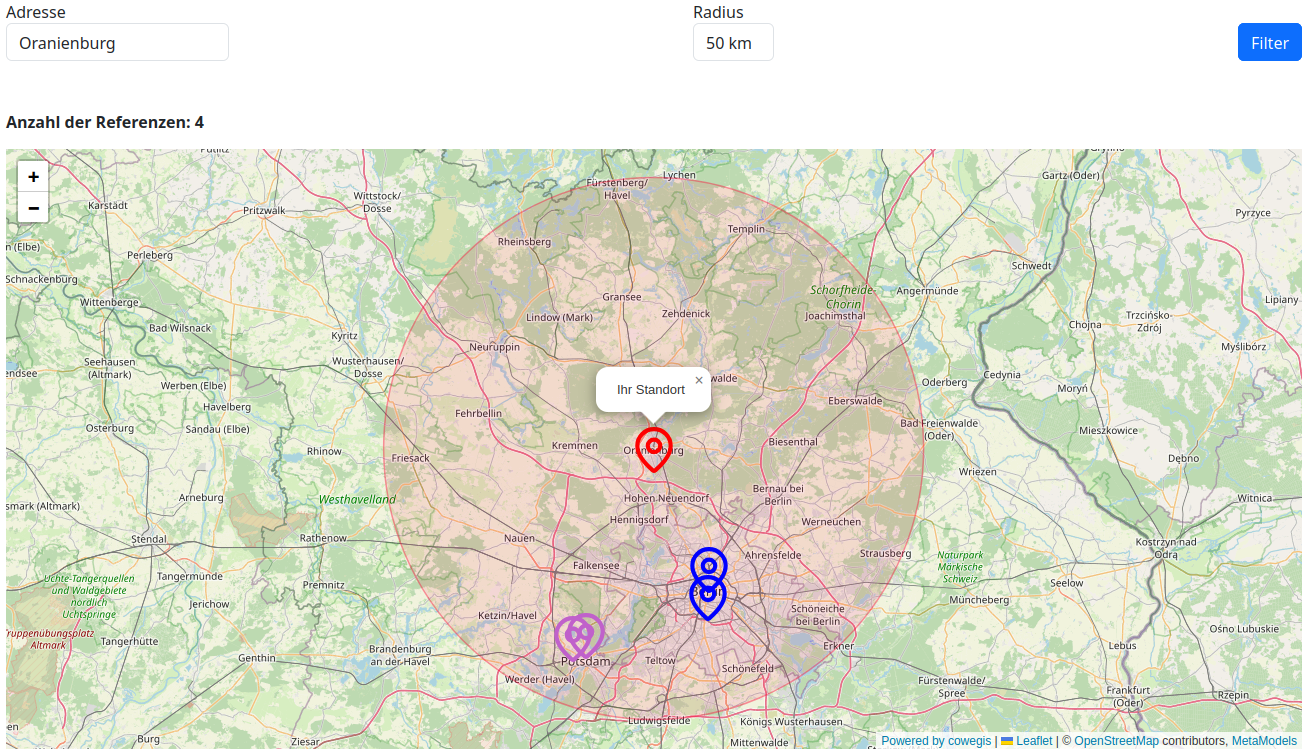
One example would be a customized display after a perimeter search showing the search point and radius.
Debugging
During development or setup of the layer, it may happen that the map is no longer displayed. The
error often lies in the fact that the transmitted JSON array cannot be parsed. In the browser’s
dev tools, the message SyntaxError: JSON.parse: unexpected character at line 1 column 1 of the
JSON data frequently appears.
In the network analysis, the request to the Cowegis API should be visible — it looks something
like https://domain.tld/cowegis/api/map/3?_locale=en&es5=1&= where the number is the map ID.
This request can be opened in a separate browser tab for analysis.
Migration from Leaflet-Maps Integration
Anyone migrating from Leaflet-Maps Integration to Cowegis-Layer should note the following:
For lat/long values stored as individual attributes, only the Decimal attribute type is supported (see “Creating MetaModels Data” above) — anyone who previously stored these values in a Text attribute type must adjust that attribute type
Donations
Thanks for the donations* for the extension to:
AntwortInternet: 200 €
P-Kreativ: 200 €
Biades: 200 €
AntwortInternet: 200 €
External IT Solutions: 200 €
Klarika: 200 €
(*Donations are net amounts)